load average
So what’s CPU load average?
Let’s explain CPU load first. CPU load is the number of processes which are being executed by CPU or waiting to be executed by CPU. So CPU load average is the average number of processes being or waiting executed over past 1, 5 and 15 minutes. (会有一个进程队列,等待CPU去调度执行,该队列中进程的数量即为CPU Load)
Below is an example to understand the relationship between load average and CPU cores:
1 | 23:16:49 up 10:49, 5 user, load average: 1.00, 0.40, 3.35 |
On single core system this would mean:
- The CPU was fully (100%) utilized on average; 1 process was running on the CPU (1.00) over the last 1 minute.
- The CPU was idle by 60% on average; no processes were waiting for CPU time (0.40) over the last 5 minutes.(过去五分钟的load avg为0.4,必定会有一些时刻进程队列为空,没有进程需要CPU时间,所以平均来说,CPU有60%是空闲的)
- The CPU was overloaded by 235% on average; 2.35 processes were waiting for CPU time (3.35) over the last 15 minutes.
On a dual-core system this would mean:
- The one CPU was 100% idle on average, one CPU was being used; no processes were waiting for CPU time(1.00) over the last 1 minute.
- The CPUs were idle by 160% on average; no processes were waiting for CPU time. (0.40) over the last 5 minutes.
- The CPUs were overloaded by 135% on average; 1.35 processes were waiting for CPU time. (3.35) over the last 15 minutes.
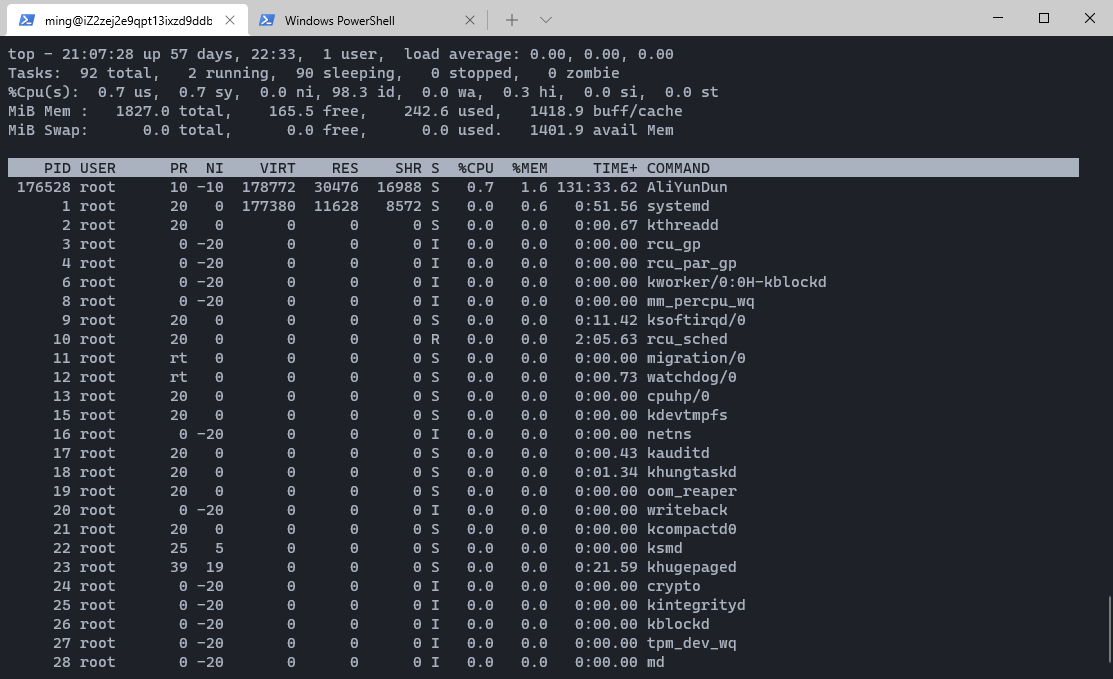
PS: uptime也可以用来查看CPU load,而top查询的结果包含了uptime的结果。

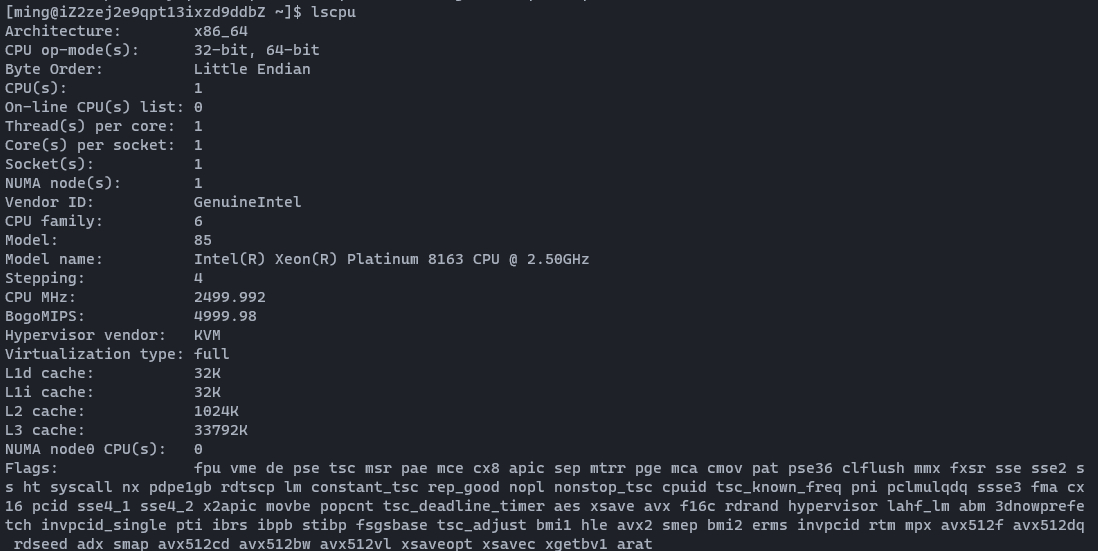
可以用lscpu查看cpu的信息:
TASK and CPU States
shows total tasks or threads
us, user : time running un-niced user processes
sy, system : time running kernel processes
ni, nice : time running niced user processes
id, idle : time spent in the kernel idle handler
wa, IO-wait : time waiting for I/O completion
hi : time spent servicing hardware interrupts
si : time spent servicing software interrupts
st : time stolen from this vm by the hypervisor
hi
hi is the time spent processing hardware interrupts. Hardware interrupts are generated by hardware devices (network cards, keyboard controller, external timer, hardware sensors, …) when they need to signal something to the CPU (data has arrived, for example).
Since these can happen very frequently, and since they essentially block the current CPU while they are running, kernel hardware interrupt handlers are written to be as fast and simple as possible.
si
根据我在计组课上学过的知识,CPU的速度与键盘、打印机这种低速设备的速度相差甚远,要处理硬件设备的请求,如果让CPU去轮询硬件设备,大部分时间都会花在等IO上,很耗费CPU时间,所以采用类似事件订阅的一种机制:当硬件准备好时,向CPU发送中断请求。
CPU设置了一组中断向量,比如从0到64,不同的中断向量对应着不同的处理代码(想想当初在8086上写汇编的日子,INT 60),当硬件设备有要处理的任务时,会向CPU发起一个中断请求。CPU接受到请求后,根据中断号,会跳转到对应的中断处理程序上,执行相应代码。
中断程序有个特点,它在执行的过程中不能再被中断(CPU在此期间会屏蔽中断请求)。在交互性很强的桌面系统里,响应时间甚至要比吞吐量来的更重要一些,假如某个中断程序的执行时间过长,就会影响到响应时间,所以中断处理的时间要尽量的短。
解决这个问题,linux将处理中断的routine一分为二:
a ‘top half’ which receives the hardware interrupt and a ‘bottom half’ which does the lengthy processing.
因为中断程序执行的时间很短,所以多核CPU同步的时候,可以用自旋锁(spinlock)。自旋锁采用忙等待的方式(时刻准备着),耗费CPU时间,但比一般的互斥锁效率更高。
MEMORY Usage
This portion consists of two lines which may express values in kibibytes (KiB) through exbibytes (EiB) depending on the scaling factor enforced with the `E’ interactive command.
As a default, Line 1 reflects physical memory, classified as: total, free, used and buff/cache
Line 2 reflects mostly virtual memory, classified as: total, free, used and avail (which is physical memory)
The avail number on line 2 is an estimation of physical memory available for starting new applications, without swapping.
%CPU
What is CPU usage?
类似那种时分复用的思想,将CPU时间划分成多个时间片(时分复用帧),不同的线程占用不同的时间片。时间片是在可运行的任务之间轮转,阻塞在IO或者在等事件、等锁的任务是不可运行的,不参与轮转。
The task’s share of the elapsed CPU time since the last update, expressed as a percentage of total CPU time.
In a true SMP environment, if a process is multi-threaded and top is not operating in Threads mode, amounts greater than 100% may be reported.
reference
[What is CPU Load Average (tenable.com)](https://community.tenable.com/s/article/What-is-CPU-Load-Average#:~:text=CPU load is the number,1%2C 5 and 15 minutes.)